Field note · Advertising
ROAS Is Not Profit: Reconcile Ad Reports With Product Economics
A revenue-based campaign can report 3.0x ROAS while its fulfilled orders lose contribution after refunds. This analysis follows one synthetic 200-order cohort from $9,000 of checkout revenue to a $112 loss. Every cost and recovery credit is shown, so the gap can be reproduced rather than explained away as a vague reporting difference.

Start with what your conversion value represents
ROAS divides reported conversion value by ad spend. When conversion value represents merchandise revenue, the ratio does not automatically deduct product, shipping or acquisition costs. Some advertisers deliberately submit a profit-based conversion value instead. Check the measurement configuration before interpreting a ratio; this article assumes revenue-based reporting throughout.
A 3.0x result means three revenue dollars were attributed for each advertising dollar under the chosen reporting rules. It does not identify how much of that revenue was refunded, how much inventory was consumed, or whether a second advertising platform also claimed the order. Those questions require a matched financial ledger and a clear attribution boundary.
Audit a synthetic 200-order cohort
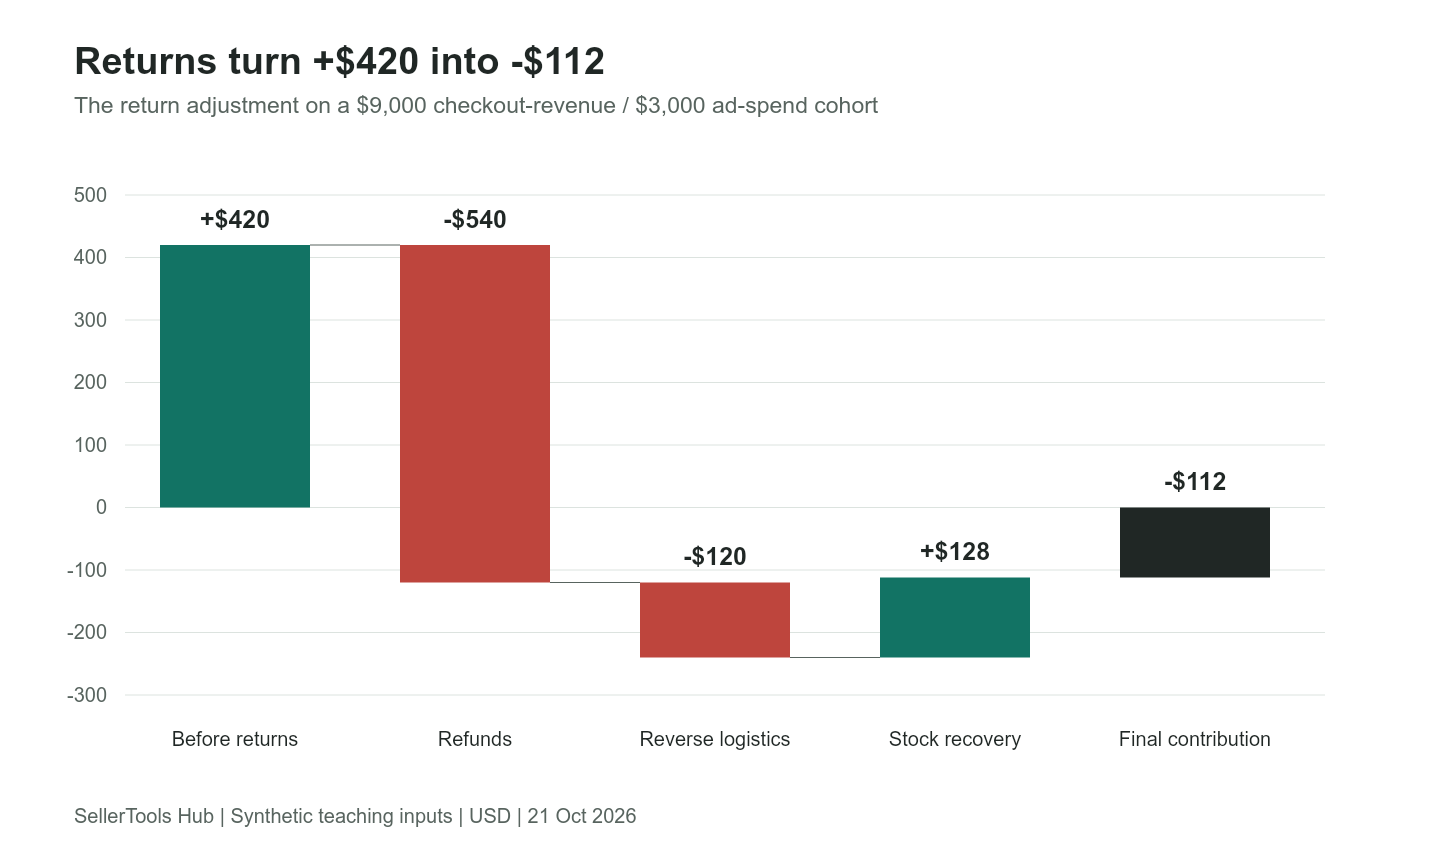
The teaching cohort contains 200 delivered orders. Each order has a $50 merchandise price and a $5 seller-funded discount, making checkout merchandise revenue $9,000. Sales tax is excluded. Advertising allocated to the cohort costs $3,000. Before returns, product and non-ad variable costs total $5,580, leaving $420 after advertising.
Later, 12 orders are fully refunded at $45 each. Eight returned units recover their original $16 inventory cost; four have no recoverable goods value. Reverse shipping and handling cost $10 for each returned order. The original fees are assumed retained, with no additional fee credit. These are chosen assumptions, not a platform's price list.
| Ledger line | Calculation | Amount |
|---|---|---|
| Gross merchandise | 200 × $50 | $10,000 |
| Seller-funded discounts | 200 × $5 | −$1,000 |
| Checkout merchandise revenue | Before refunds | $9,000 |
| Refunds | 12 × $45 | −$540 |
| Landed product cost | 200 × $16, initially charged once | −$3,200 |
| Outbound fulfillment | 200 × $7 | −$1,400 |
| Original variable fees | Illustrative 4% of checkout revenue | −$360 |
| Other non-ad order costs | 200 × $3.10 | −$620 |
| Recovered inventory cost | 8 × $16 | +$128 |
| Reverse logistics and handling | 12 × $10 | −$120 |
| Advertising | Cohort allocation | −$3,000 |
| Contribution after advertising | Before overhead and tax | −$112 |
Returns reduce the original $420 by $540 + $120 − $128 = $532. Subtracting the $192 cost of all 12 returned products again would be incorrect: the initial $3,200 already charged every delivered unit. Instead, credit only the recoverable cost of stock that can be used again. Inventory recovery is an asset adjustment, not a cash payout.
Campaign contribution reconciliation
- Net merchandise revenue
- $8,460.00
- Contribution after ads
- −$112.00
- Net-revenue ROAS
- 2.82x
- Break-even net-revenue ROAS
- 2.93x
Keep all inputs on one matched cohort. These are contribution estimates, not accounting or causal attribution conclusions.
Rebuild the threshold on the same revenue definition
After returns, net merchandise revenue is $8,460. Contribution before ads is $2,888, so the pre-ad contribution rate is approximately 34.14%. Break-even net-revenue ROAS is $8,460 ÷ $2,888 = 2.93x. Actual net-revenue ROAS is $8,460 ÷ $3,000 = 2.82x. The campaign is below its matching threshold even though the original dashboard still shows 3.0x.
To preserve a 10% contribution margin on that same net revenue, the model can allocate $2,888 − $846 = $2,042 to ads. Its corresponding target is approximately 4.14x. This is a scenario target, not a guaranteed bid outcome. Comparing the dashboard's gross ratio with a net-revenue threshold would mix incompatible denominators.
Resolve overlapping claims before adding channels
A shopper might click a search ad, watch a social ad and later buy directly. Different systems can give credit to that same order. Adding attributed revenue from two advertising dashboards can therefore exceed store revenue without either dashboard containing an arithmetic error. Export order or transaction identifiers where permitted and compare reporting windows before treating the sum as new sales.
Google's attribution documentation describes how credit is allocated among interactions. Its conversion-adjustment guidance also covers restating value and retracting conversions after events such as returns. Use the documented process appropriate to your tracking setup; reducing a total in a spreadsheet does not automatically update the bidding system.
Keep three views beside each other
| View | This example | What it answers |
|---|---|---|
| Original revenue-based platform ROAS | 3.00x | What value the ad account attributed |
| Net cohort revenue / assigned spend | 2.82x | How refunds change the comparable revenue |
| Contribution after assigned ads | −$112 | What remains after the stated variable costs |
None of these proves incrementality. Even a correctly reconciled cohort could contain orders that would have arrived without advertising. Nor is contribution identical to net income: payroll, rent, financing, tax and other fixed costs still need to be covered. Label each view accurately rather than compressing every question into one “profit ROAS” number.
Close the review with a specific discrepancy
In this example the largest discovery is not a new formula. It is the $532 return adjustment that overturns the original conclusion. Review the return reasons, product promise and recoverability before raising spend. Then rerun the expected case with actual landed cost and current fulfillment invoices. Keep a dated copy of the ledger so a later campaign review can distinguish a reporting correction from an improvement in the underlying business.
Common questions
Is 3x ROAS good?
Only in relation to the contribution rate, revenue definition and relevant overhead. Two products with the same reported ratio can produce opposite financial outcomes.
Why are recovered goods added back?
The initial cost model charges every shipped unit. Recovering a sellable unit reverses only its recoverable inventory cost. It does not create another sale or immediate cash receipt.
Should refunds also be put in a return allowance?
Use actual refunds for mature cohorts or an expected allowance for immature cohorts. Charging both for the same orders duplicates the loss.
Can ad conversion value represent profit?
Yes, an advertiser can choose value inputs that represent business value rather than revenue. Verify the account's configuration before applying this revenue-based example.
Why not reconcile only by payout date?
Payouts can include sales, fees and refunds from different order dates. A payout view helps cash planning; an order-cohort view helps explain product contribution.
Does this model include tax or fixed salaries?
No. It isolates contribution after the entered variable costs and advertising. Add the remaining expenses in a full accounting and cash-flow review.
Sources and method
SellerTools Hub model, October 21, 2026. The cohort is constructed for reproduction and is not sampled from merchant accounts. Platform sources describe measurement mechanics, not the scenario's prices or costs.
The campaign numbers are an educational reconciliation. Replace attributed revenue, margin and spend with a consistent reporting window from your store.